|
|
Tutorial - Chart Note: Before reading this tutorial, please read Chart Setup first. In this tutorial we will show you how to create a chart to present report data in ASP.NET Report Maker. We will use the demo database for demonstration. In this tutorial we'll create a chart to show the total order amount by product category. We'll continue to use the Crosstab Report we created in the Crosstab Report tutorial. Steps to Create the Chart 1. Loading ASP.NET Report Maker Open ASP.NET Report Maker and connect to the demo.mdb database. 2. Adding a Chart To add a chart to a report, click the report in the database pane on the left, the tabbed Field Setup page and Chart Setup Page will show up on the right. Click the [Charts] tab to go the Chart Setup Page. Click [+] button to add a new chart. Enter chart name as "Orders By Category". We want to draw a column chart so we leave the [Type] setting unchanged at the default value - [Column]. Under [Category (X) Axis], select "CategoryName" for the [Field name] setting. Since the category names are a little long, we'd better rotate the category names by 30 degrees, so we enter "30" for the [Category rotation] setting. Under [Category (Y) Axis], select "Amount" for the [Field name] setting. Check [Show labels] so we'll see the category names on the X axis. Check [Show values] so we'll see the amount at the top of each column. Check [Show hover] so we'll see a hovering box displaying the category name and its amount when we move the mouse over each column.
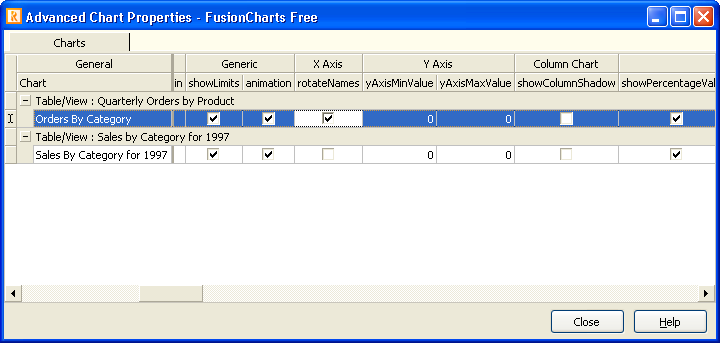
There are many other advanced chart properties for you to config the chart, click Tools->Advanced Chart Properties to open the setup form:
In this example, we rotate the category names on the X axis so they win't overlap each other.
3. ASP.NET Script Generation Go to the [Generate] tab, click the [Generate] button and ASP.NET Report Maker will generate the required ASP.NET scripts automatically. 4. Running the ASP.NET Application Click the "Reports" menu button and select "Quarterly Orders by Product" (or select the sub-menu "Orders By Category") to run the report and see the chart.
|
| ©2007-2010 e.World Technology Ltd. All rights reserved. |