| |
FusionCharts Free |
FusionCharts (extension for registered users only) |
| Overall Difference |
Charts created in
|
Flash MX / ActionScript 1 |
Adobe Flash 8 / ActionScript 2 |
| Animation in charts |
All Charts except Stacked 3D Column and Candlestick Charts support animation |
All charts support animation |
In-built visual debugger for easy debugging
|
No |
Yes. The debugger points out if there were any problems in loading data or with the data itself. |
JavaScript (HTML 5) charts
|
No |
Yes |
| Chart Types |
| Column Chart |
Both 2D & 3D
|
Both 2D & 3D, with 3D-lighting and gradients. Also, glass effect column chart supported
|
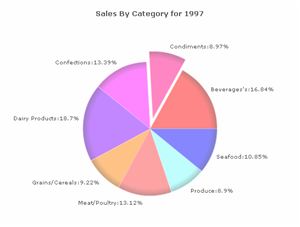
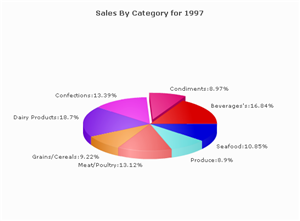
| Pie Chart |
Both 2D & 3D
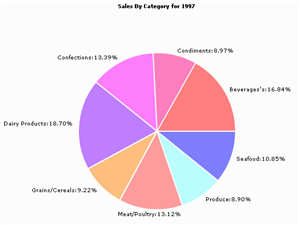
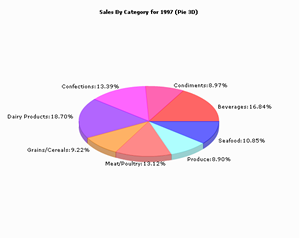
|
Both 2D & 3D, with 3D-lighting and gradients. Also, interactive slicing and rotation are supported.
|
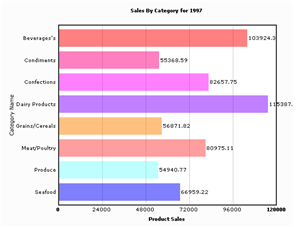
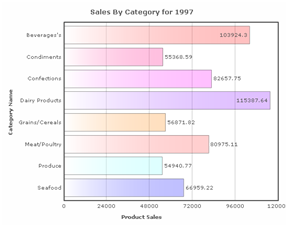
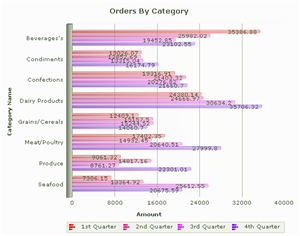
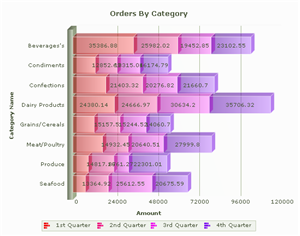
| Bar Chart |
2D
|
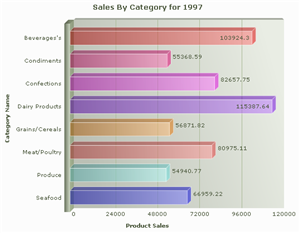
Both 2D & 3D, with 3D-lighting and gradients.
|
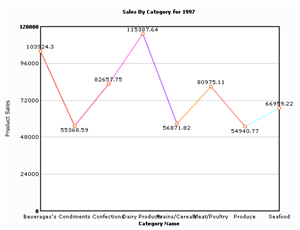
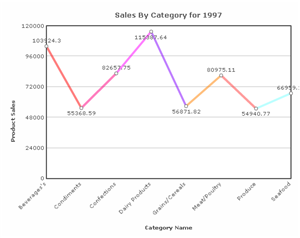
| Line Chart |
2D
|
2D
|
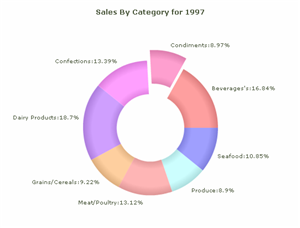
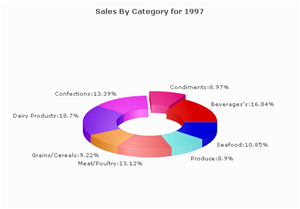
| Doughnut Chart |
2D
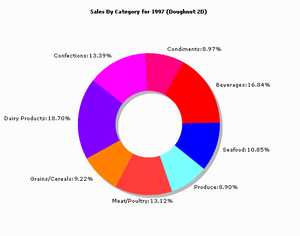
|
Both 2D & 3D, with 3D lighting and gradients. Also, interactive slicing and rotation are supported.
|
| Area Chart |
2D
|
2D
|
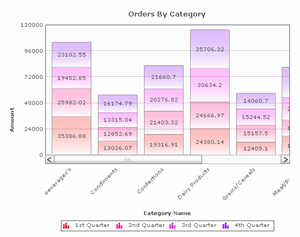
Multi-Series/Stacked Charts |
3D/2D Column, 2D Bar, 2D Line and 2D Area Charts
|
2D Line and 2D Area Charts. Both 2D & 3D Bar and Column charts, with 3D lighting and gradients
|
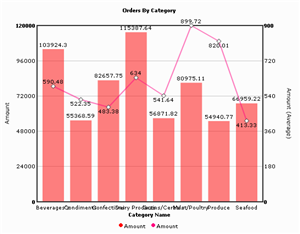
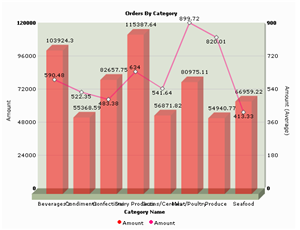
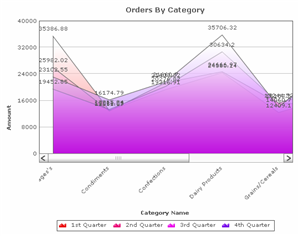
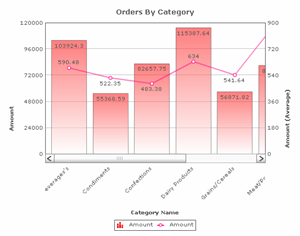
| Dual Y Axis Combination Charts |
2D/3D Column (primary Y Axis) & Line (secondary Y Axis)
|
2D/3D Column (primary Y Axis) & Line (secondary Y Axis). Support for 3D lighting effect and gradient fills. Scrollable charts available (see below).
|
Scrollable charts
|
No |
Yes. 2D Column, line and area charts with scrollable x-axis
|
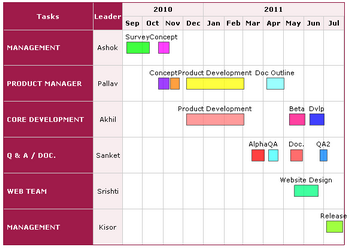
| Gantt Chart |
Yes
|
* Not included in FusionCharts, use FusionCharts Free.
|
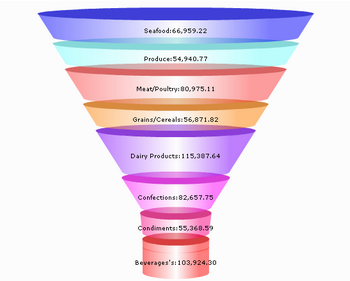
| Funnel Chart |
Yes
|
* Not included in FusionCharts, use FusionCharts Free.
|
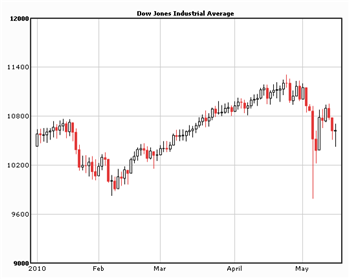
Candlestick Chart
|
Yes
|
* Not included in FusionCharts, use FusionCharts Free.
|
| Features |
Gradients and 3D Lighting
|
No |
Yes. Gradients allow for gradient fill for the data plot, the canvas and the chart background. 3D lighting gives a realistic 3D feel to the charts |
| Entire chart as hot-spot |
No |
Yes |
Smart labels in Pie and Doughnut Charts
|
No |
Yes |
Color Palettes
|
No |
Yes. Pre-defined color themes with visually-pleasing colors defined for all chart elements |
| Display Modes for x-axis labels |
Rotate. |
Rotate, stagger, slant and wrap. |
| Multi-lingual (UTF-8) characters |
Yes. Horizontally. |
Yes. Both horizontally and vertically. |